Extension Manager
Every installed extension, grouped by user, system, and disabled, each with its live status.
- Enable or disable with a single click
- Open an extension's source folder directly
- Install a new extension straight from GitHub
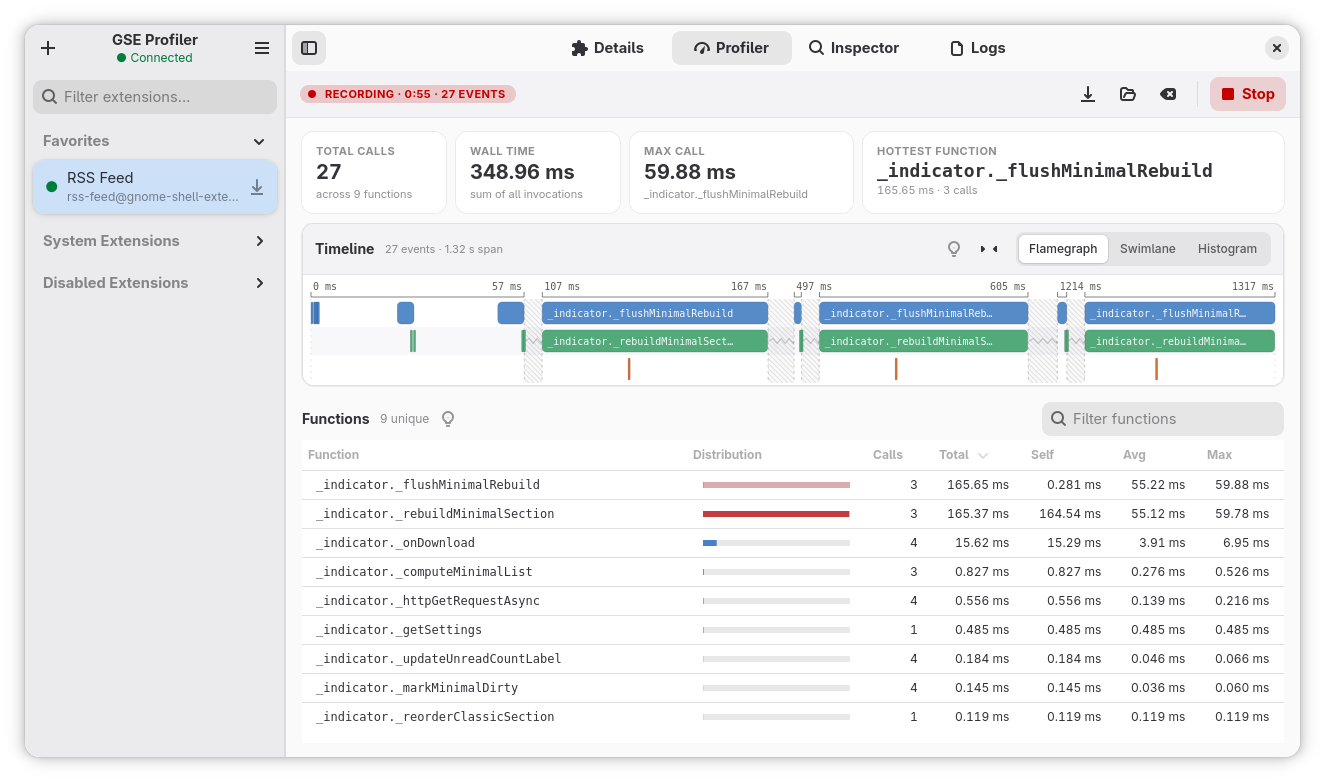
A developer toolkit for extension authors and testers. GSE Profiler attaches to the running shell and gives you live function timing, structured log filtering, and object inspection, all from a native GTK4 interface built for modern GNOME, with zero changes to your extension's code.
Free and open source · Flatpak · Stable and testing channels
Everything you need to understand a misbehaving extension, without leaving GSE Profiler. Manage it, watch its logs, time its code, and inspect its live objects.
Every installed extension, grouped by user, system, and disabled, each with its live status.
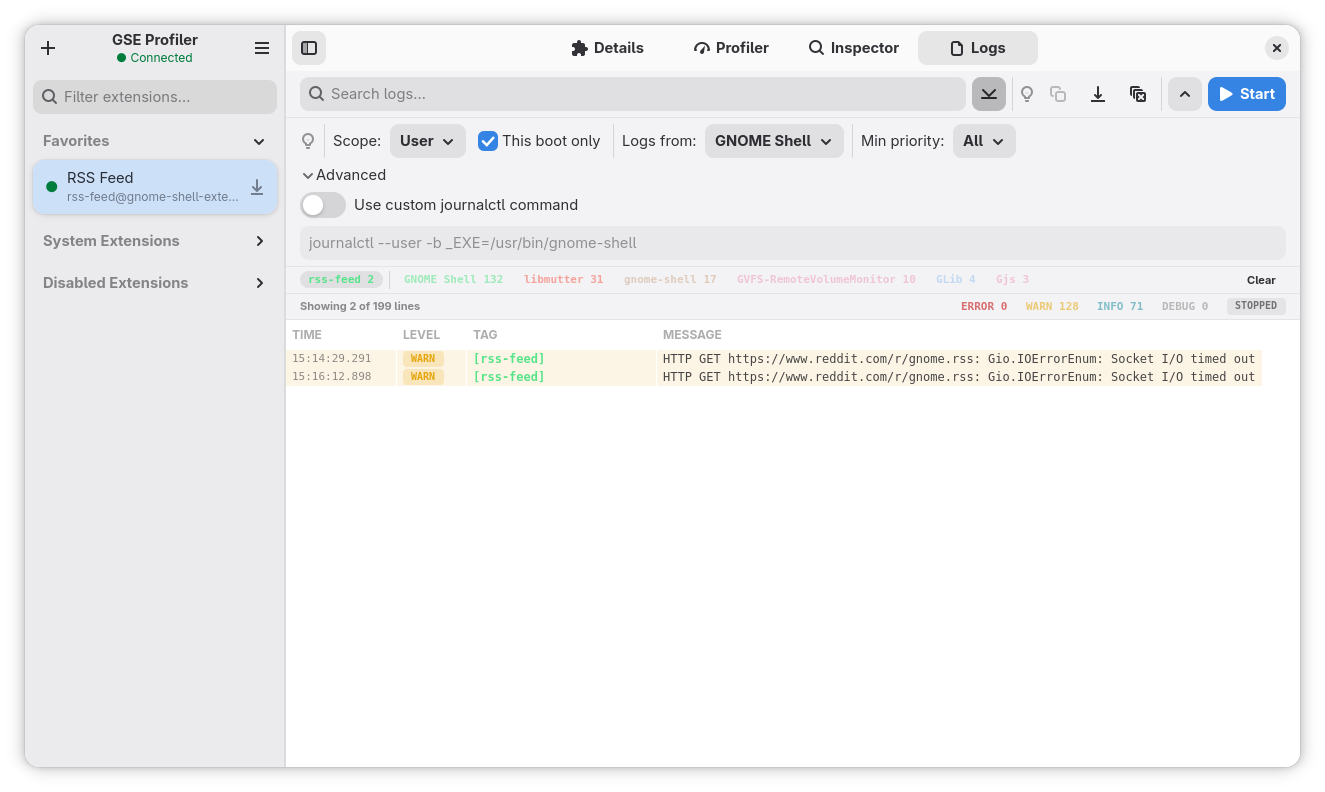
A live systemd-journal stream that captures the gnome-shell process by default, where all extensions actually run.
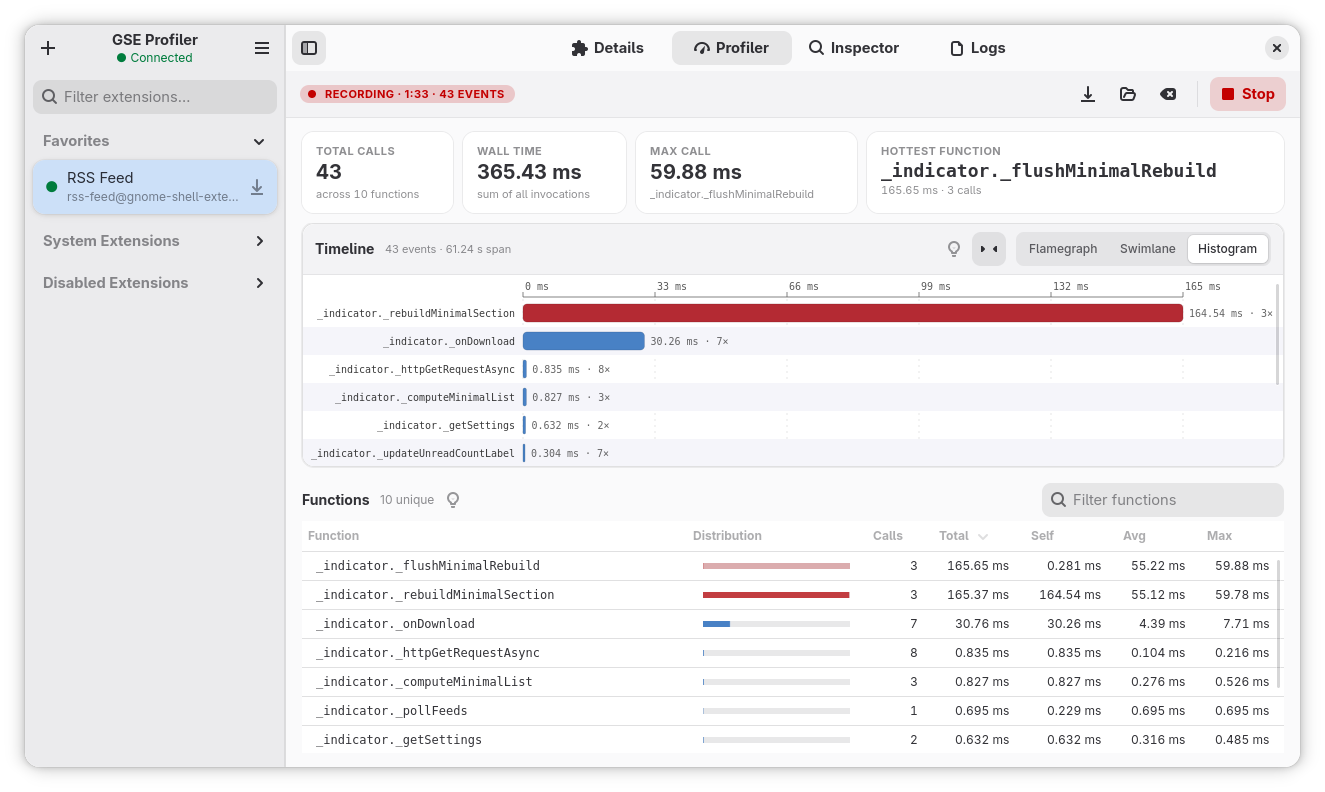
Monkey-patch any extension at runtime to measure where its time goes. No code changes needed.
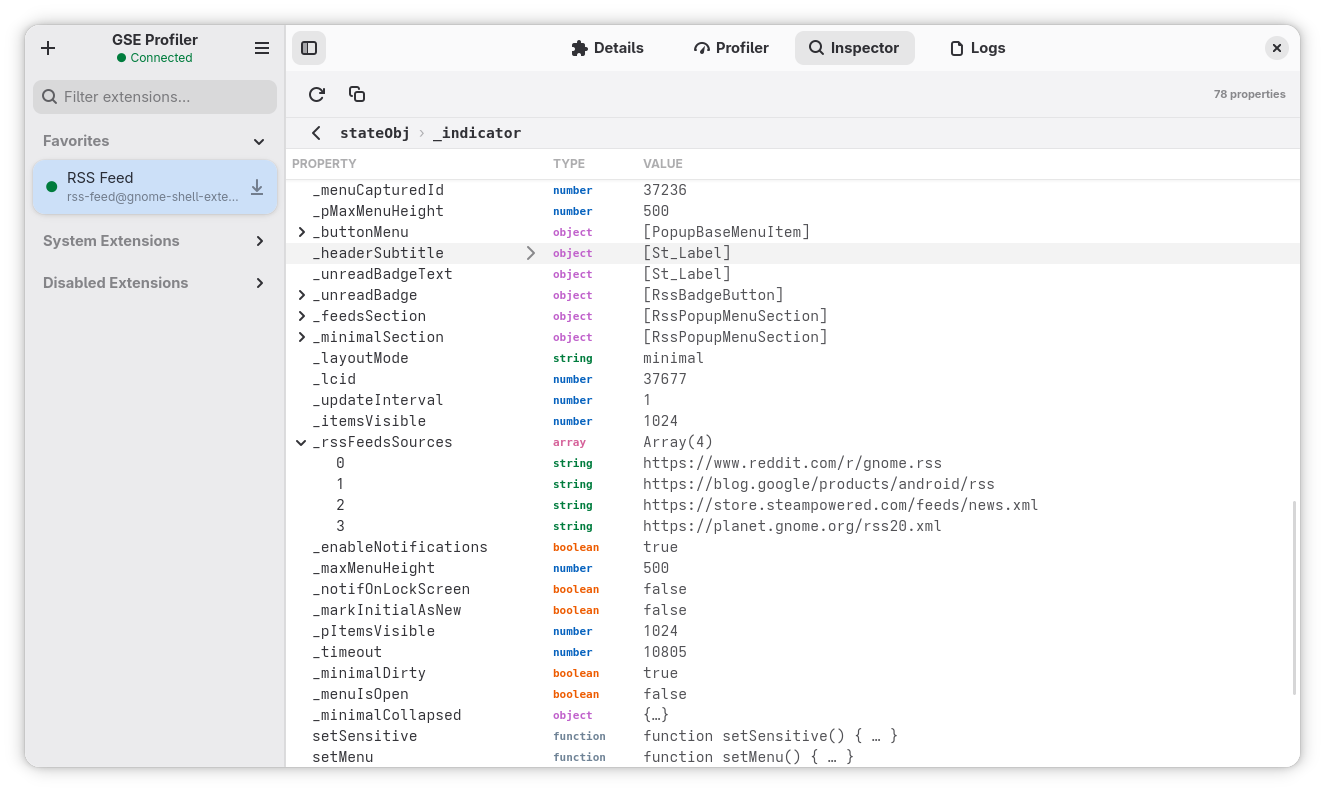
Open a live extension object and walk through it while the shell is running.
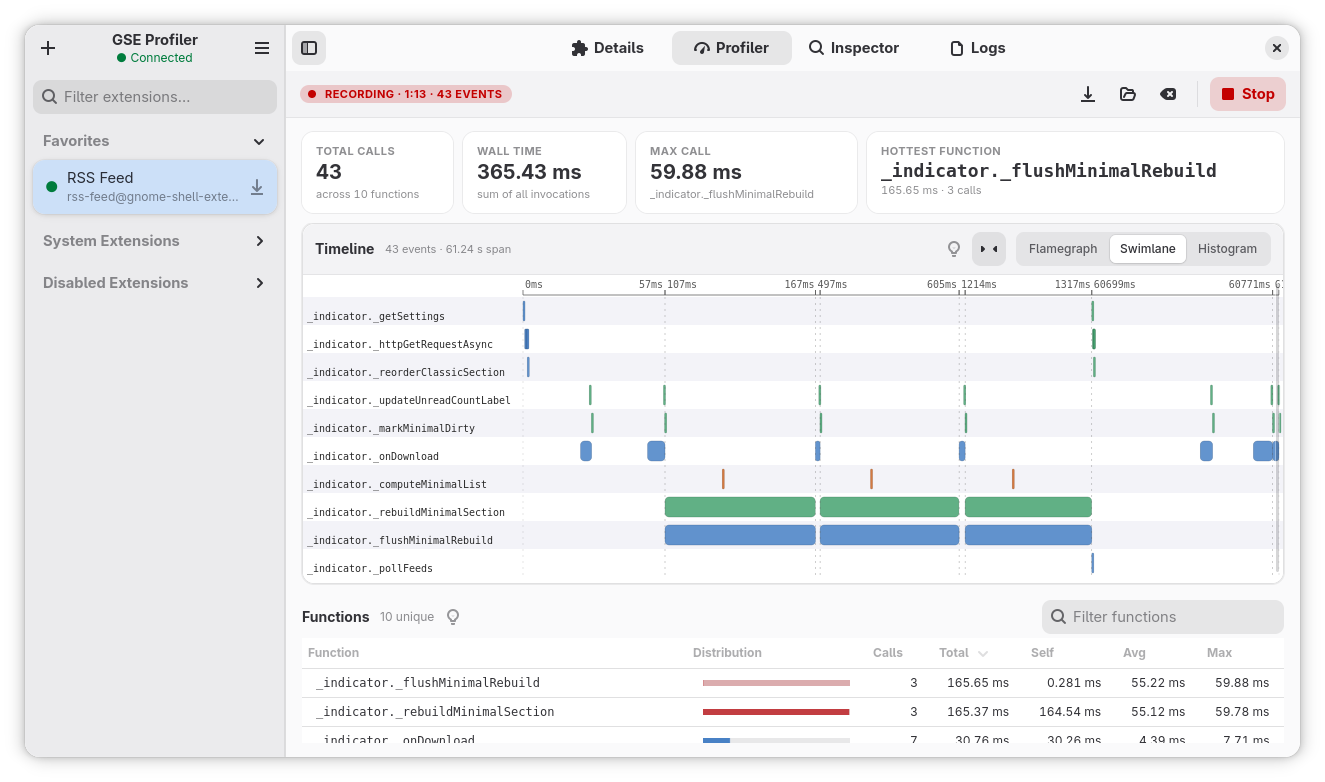
Real captures from a profiling session against a live RSS feed extension.
Nested calls laid out along a real time axis. A function that fires repeatedly, and the rebuild it triggers underneath, is obvious at a glance.
A live systemd-journal stream scoped to the gnome-shell process. Filter by level, tag, and full-text search, with warnings and errors highlighted as they arrive.
Drill into a running extension object and read its properties and methods with live values. Expand nested objects and arrays, and call methods to test behaviour.
GSE Profiler ships as a Flatpak from a self-hosted remote. Pick the stable channel for everyday use, or testing for early prerelease builds.
flatpak on a GNOME 47+ system.Production-ready releases for everyday use.
Prefer one click? Open the stable .flatpakref
Beta and rc builds for early testing and feedback.
Prefer one click? Open the testing .flatpakref
Offline, or prefer not to add a remote? Download the latest single-file .flatpak bundle from the GitHub releases page and install it directly.
While building my own GNOME Shell extensions I kept reaching for a modern tool to debug them, and there wasn't one. So I started writing GSE Profiler in the evenings, around work and family. It's free and open source. If it saved you an afternoon of console.log debugging, a small donation is much appreciated.